Regenerative Medicine
A lab platform for cell research that made scientists work harder than they should have to – so I set out to take the friction out of reproducing an experiment.
- Role
- Senior UX Designer
- Year
- 2021
- Team
- Project Lead, Senior Service Designer, Translator
- Tools
- Figma, Miro, Microsoft Teams, Slack
The cell-culturing process requires tremendous time and labour with repetitive tasks. The client’s current digital platform lacked intuition, creating extra effort and decreasing scientists’ ability to reproduce experiments in a reliable manner.
The project team and I were asked to understand the current pain points and opportunities, and improve the solution’s user experience, so that research scientists can manage and convey experimental data. The digital platform needed to put reproducibility and credibility at the heart of scientific research. The client needed an intuitive experience and interface for their second proof of concept, launching in October 2021.
The client
The client is a major Japanese organisation, better known internationally for their retail camera products. This project focuses on their smart IoT cell-culturing and microscopic devices, which connect to a dashboard where the data is transferred through the network for further processing.
The team
This project was a collaboration between the Australian and Japanese Designit agencies. The project team consisted of:
- Project Lead
- Senior UX Designer (me)
- Senior Service Designer
- Translator
The team and the client worked completely remotely, given everyone’s locations and the pandemic forcing work from home in both Australia and Japan. We used Microsoft Teams, Slack, Figma and Miro to collaborate online. Translation was done by the project lead and the translator, working in real time on post-it notes in Miro.
The journey
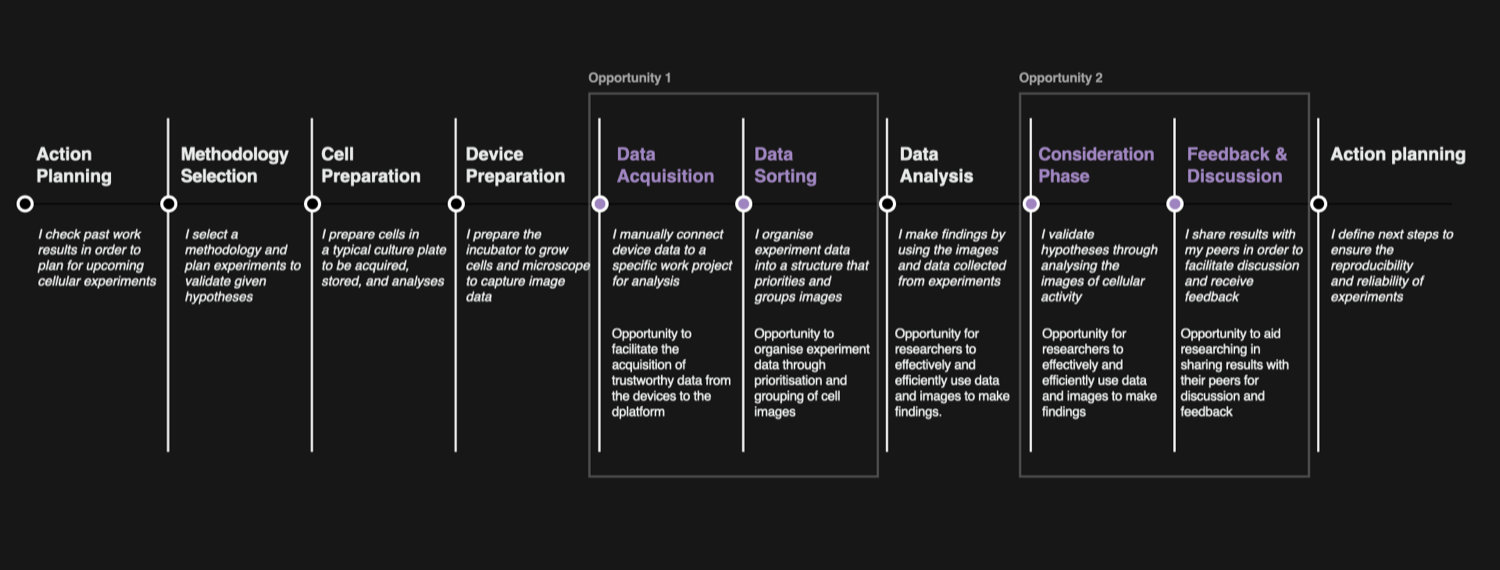
When scientists run their experiments, they work within several verticals to get to the stage of writing and publishing reports and research papers. That doesn’t mean their work is linear, but these are the major themes within a project.
Through discussions and workshops with the client, we collaboratively defined the opportunity areas that would become the focus of our thinking and strategy when ideating on the future solution.
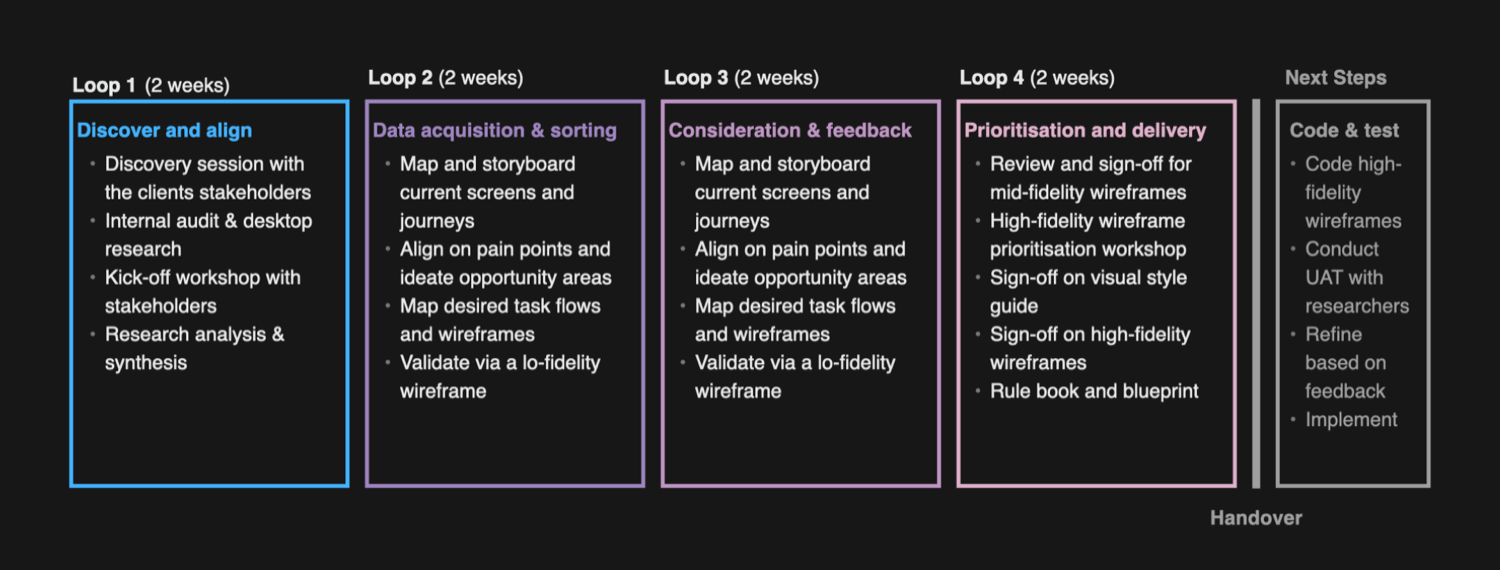
The approach
We worked agile on this project, dividing it into sprints, or “loops” as they are referred to in Japan. Each loop had a high-level description of the activities. At the end of every week we would reiterate the plan – where we were up to, what was completed, and workshopping any outputs that needed validation or feedback. This let us align with the client, collaborate with them, and help them achieve their business objectives and vision for the product.
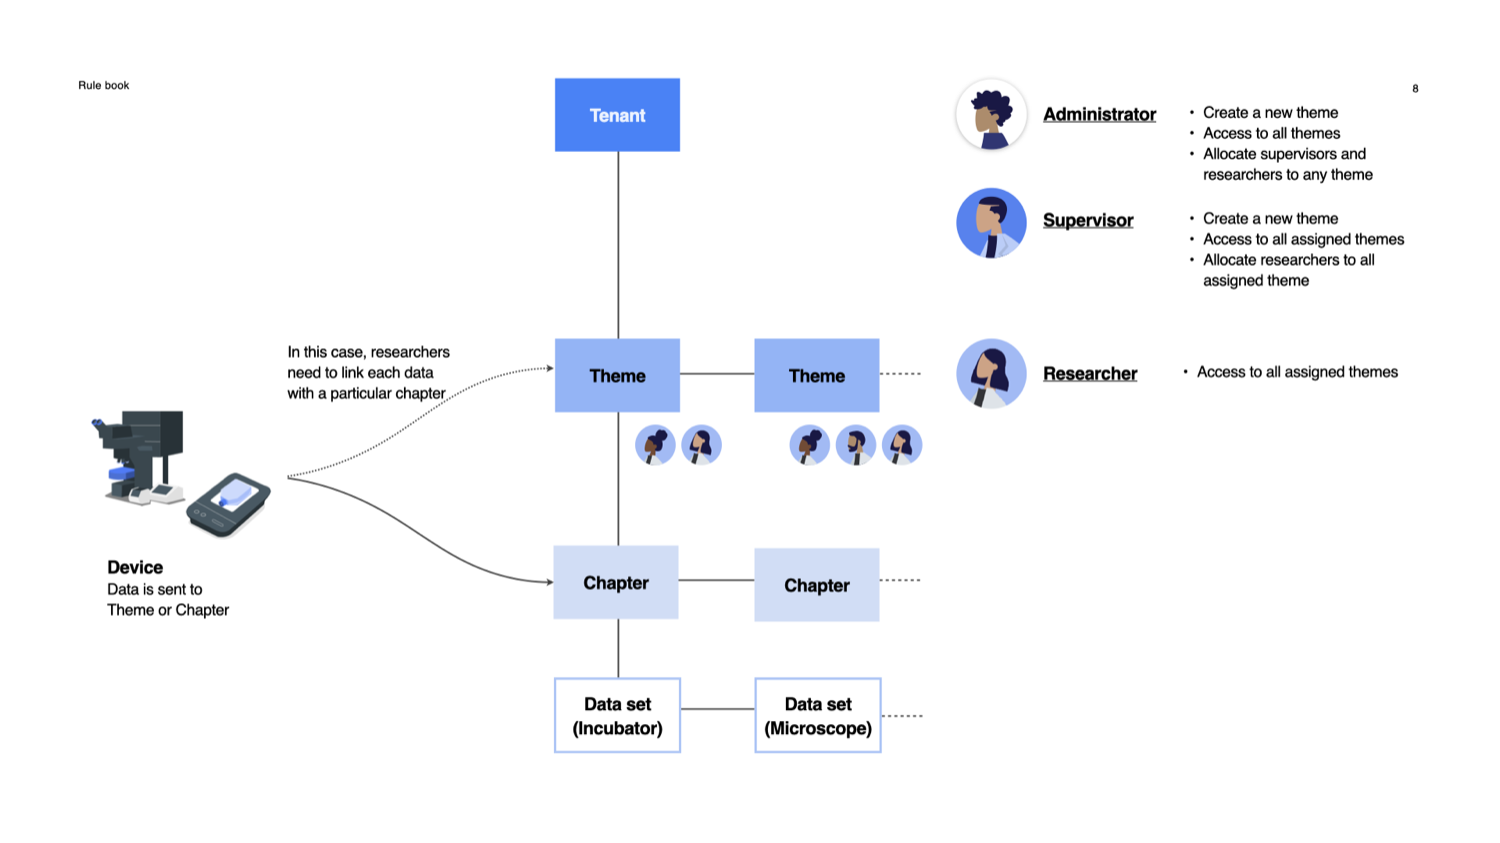
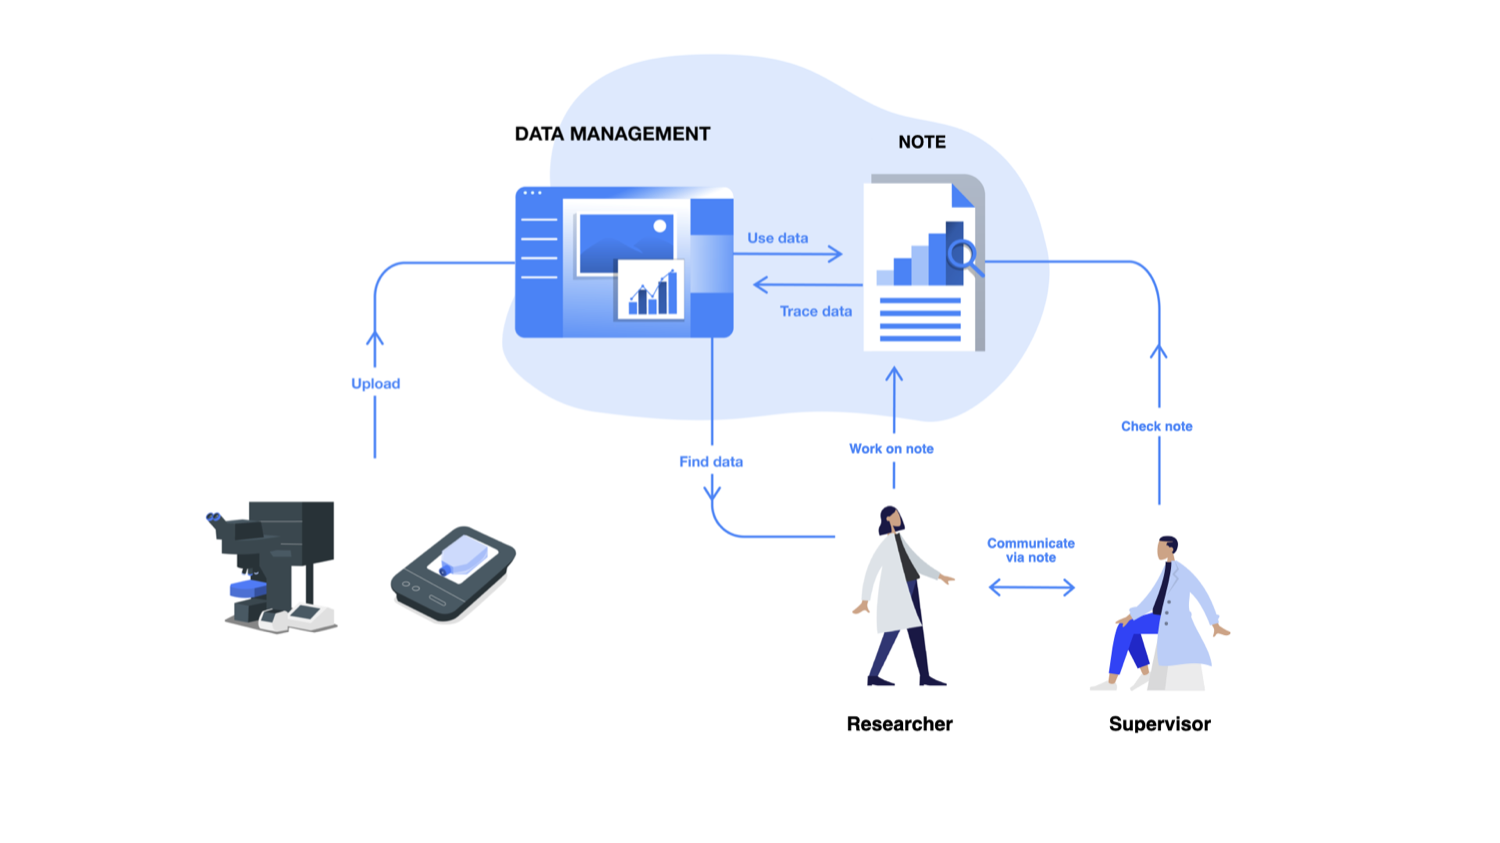
The ecosystem
The client were looking to optimise their ecosystem – cell incubators, microscopes, and the central dashboard that is the repository of the data collected by the devices. The dashboard needed the flexibility to receive that data and let users manage it, so they could note observations or discoveries, then later write reports that supervisors could access for feedback and approval.
- IoT-enabled devices – The client designed an incubation monitoring system to support scientists during cell-culturing experiments, providing qualitative and quantitative results by storing the data.
- Smart laboratories – Labs are smart facilities equipped with IoT experiment devices. The client is committed to designing devices that support the cell-culturing process, with the goal of commercialising them as products.
- Research scientists – Three user groups interact with the devices: 60% are scientists in research-centric labs, 30% in organisational labs, and 10% are independent researchers.
- Digital platform – A digital platform for researchers to manage and convey experimental data, to improve the repeatability and credibility of experiments. It’s an interface used to plan, analyse and communicate. The current solution didn’t give users this in a usable way – testing participants described the difficulty and frustration of working with the existing dashboard.
The graphic below captures the early impressions we formed diving into the first loop.
Define and align
During the discovery phase we sifted through the company’s previous user tests. As the feedback was in Japanese, we translated it and synthesised it into pain-point themes and opportunities. Through remote alignment sessions with the client, we validated our findings and narrowed the opportunities to six themes:
- Access – the path of least resistance to search, locate and access experimental data, past and present.
- Analysis – a platform to document noteworthy findings and easily analyse images.
- Reliability – improve the reliability of experimental data by making it easy to find similar experiments, data and notes.
- Collaborate – a space for researchers to work together and validate hypotheses.
- Data management – manage data efficiently: find experiments by date, use metadata and tags.
- Communicate – document communication and make it easy to find the comments that enhance the analysis of cellular data.
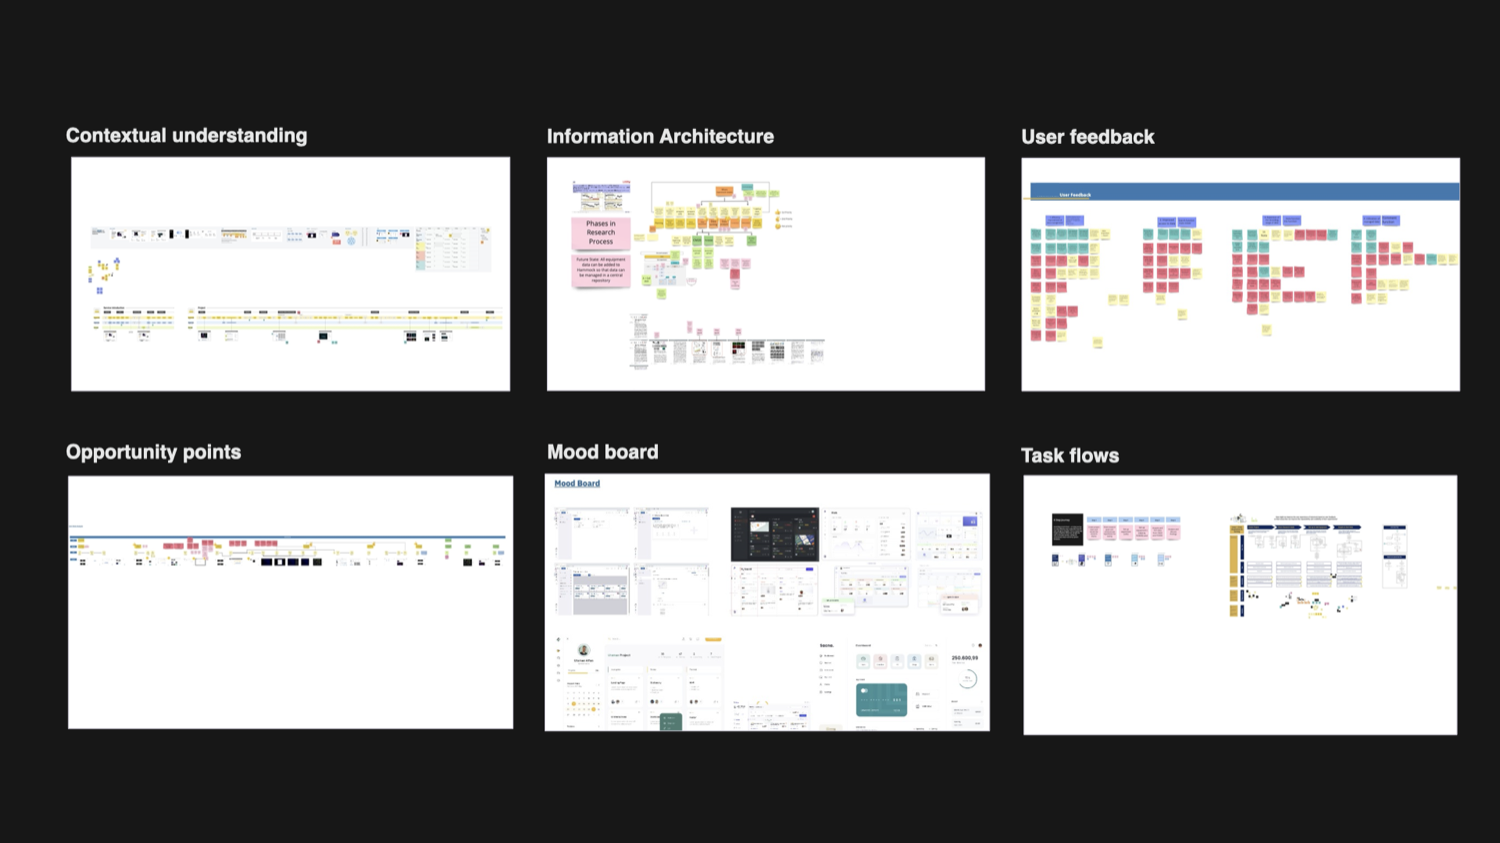
Below is a visual of the remote work completed during the discovery phase.
During discovery we spent a lot of time defining the information architecture and the flow of a project, to understand the researchers’ need for flexibility. A project has many tiers, and within them different sections and stages, as shown below. Defining the IA was a significant step to designing the solution well.
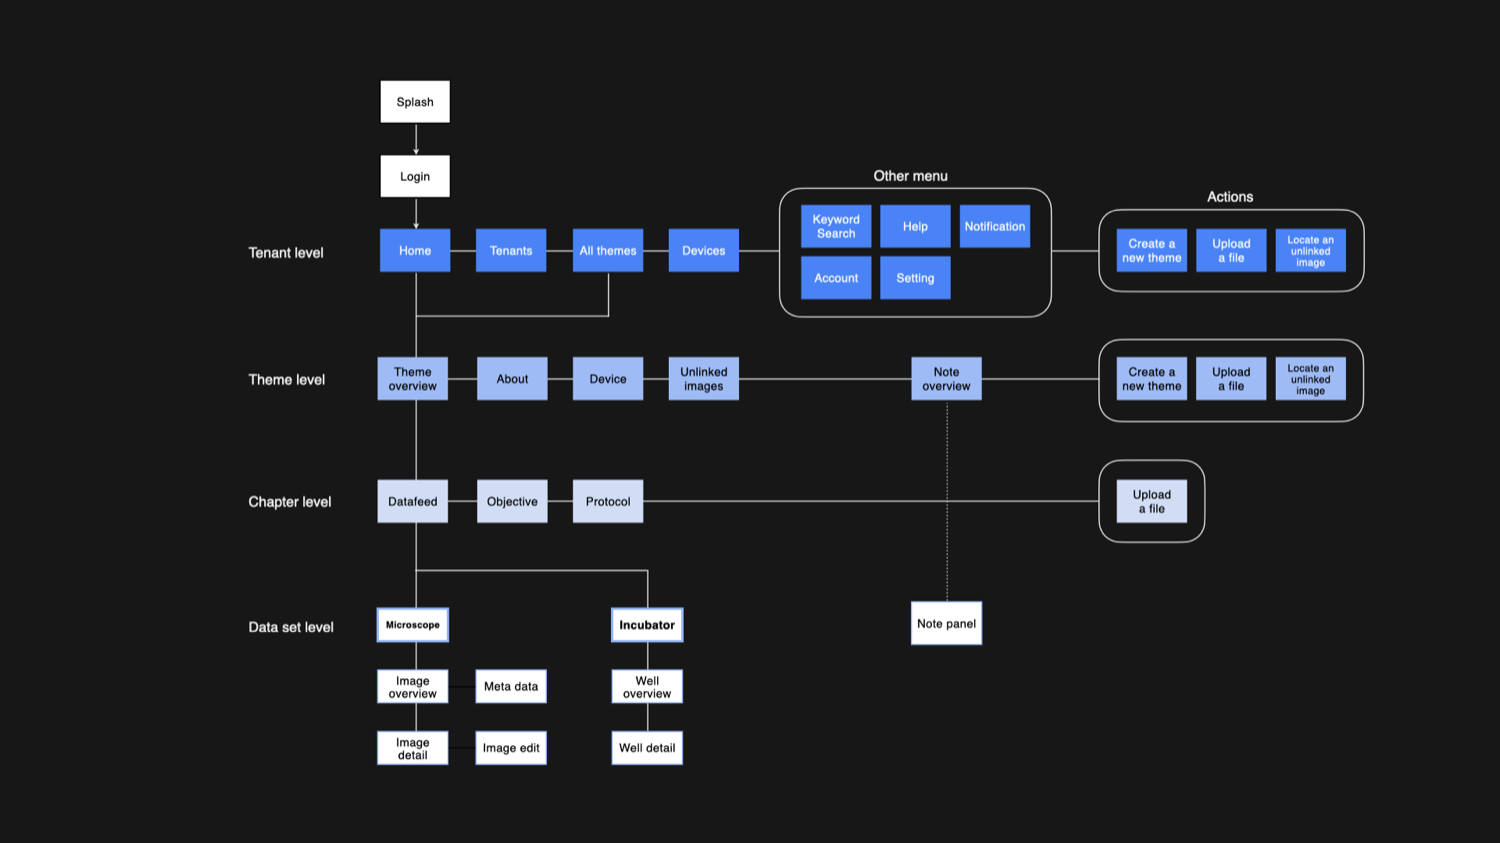
We made sure we captured the essence of the project, because guiding users through the flow of a solution is an important principle to me. The aim is to make the solution feel natural within a scientist’s workflow.
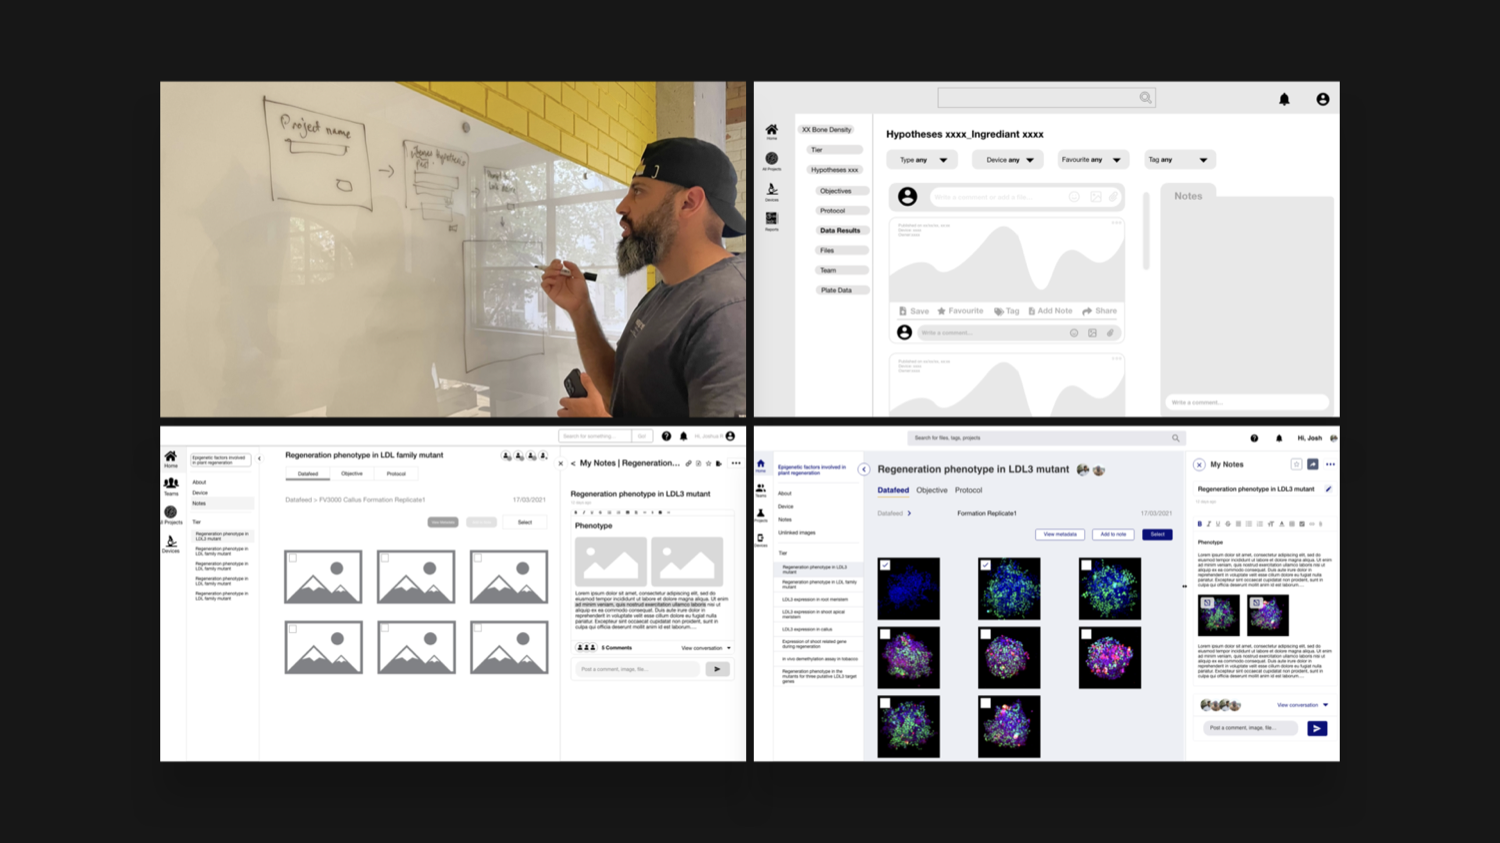
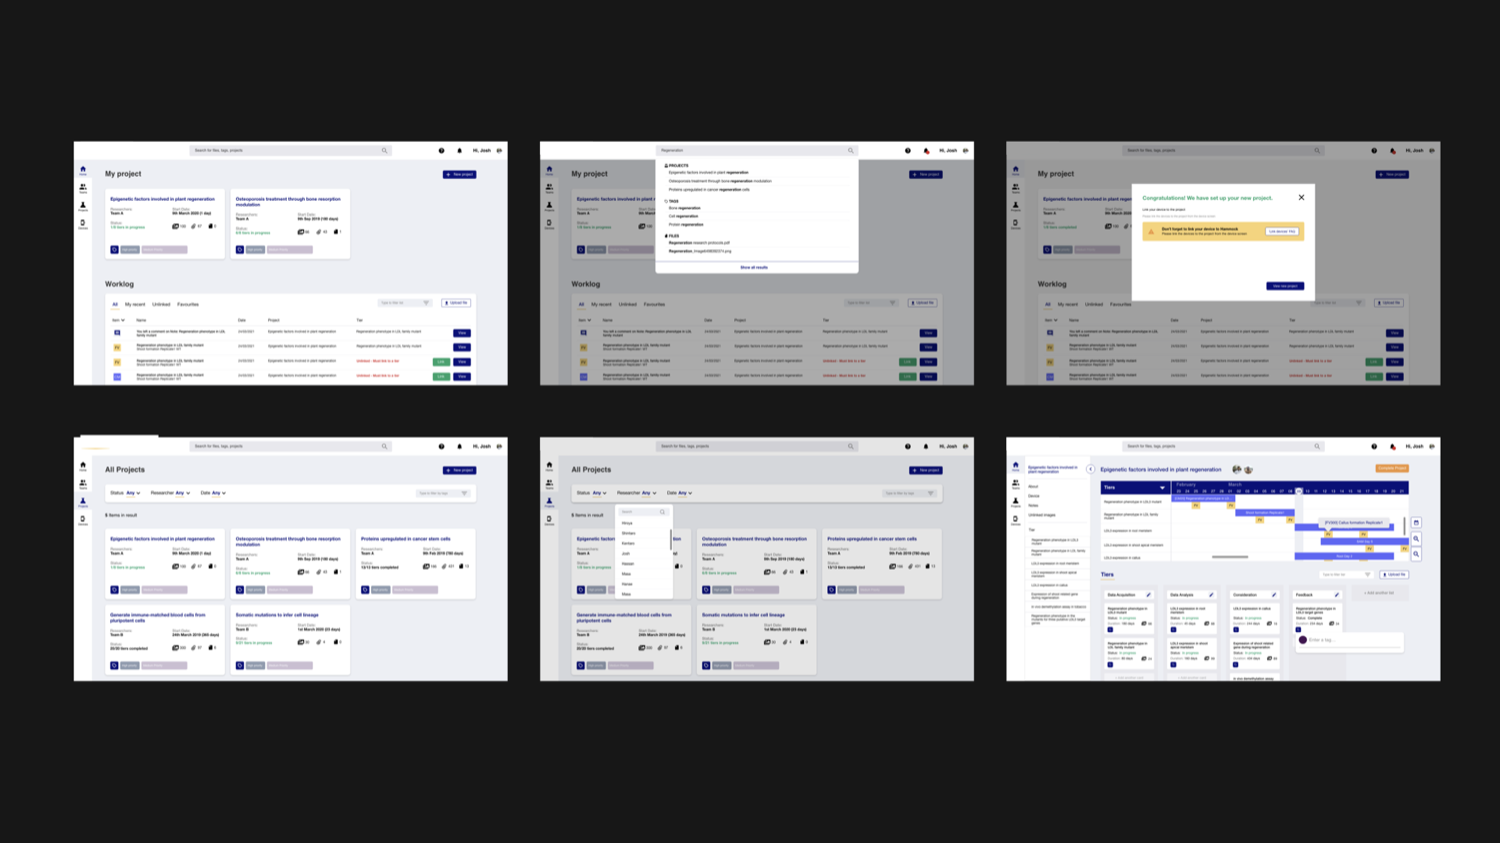
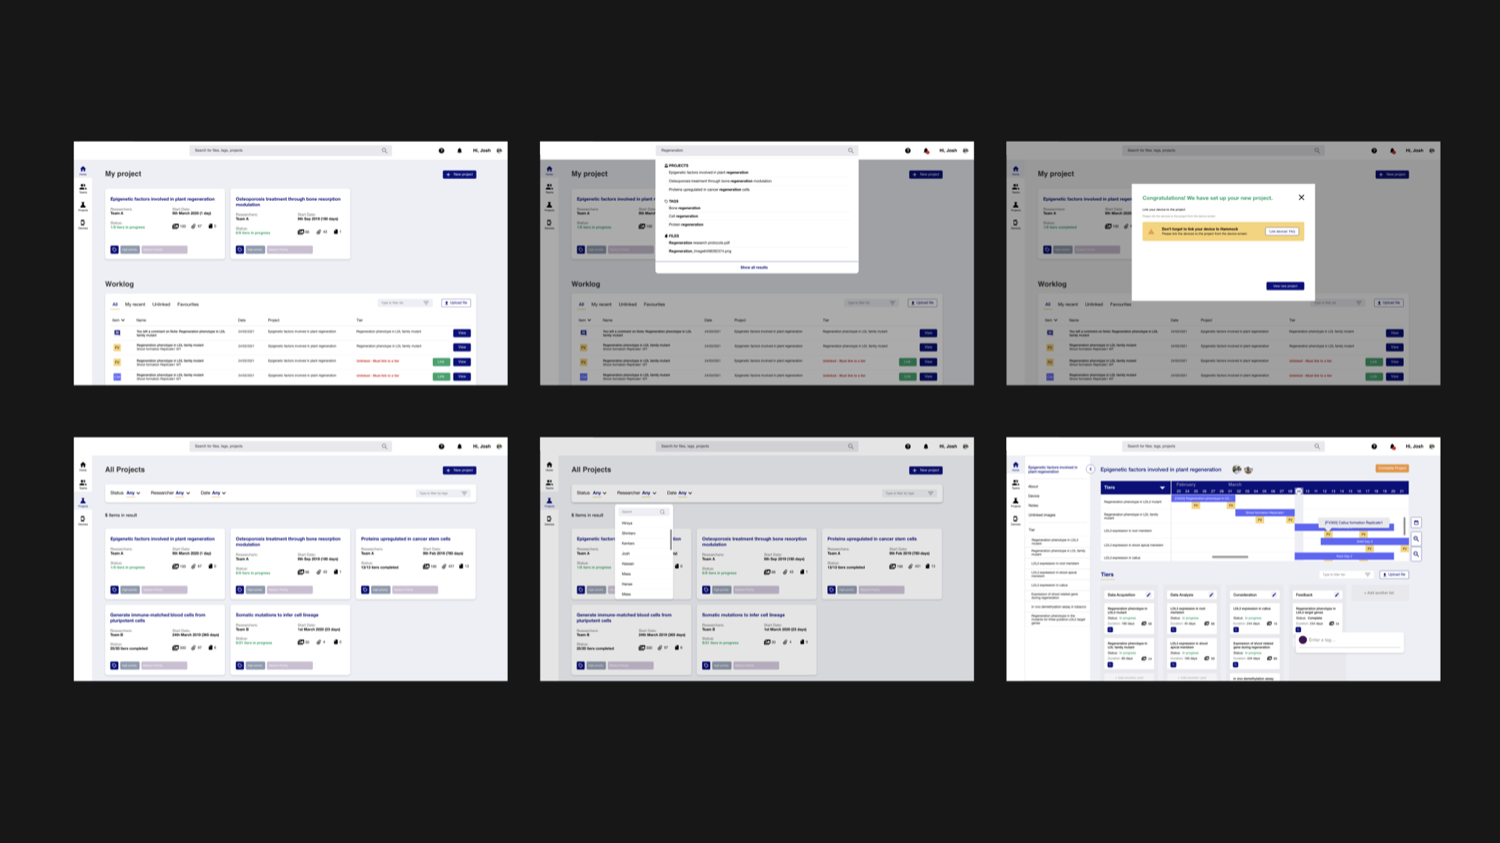
Design
During the design loops we ideated concepts with hand-drawn sketches to formalise our thinking, and validated our wireframes with the client through low-, mid- and high-fidelity designs.
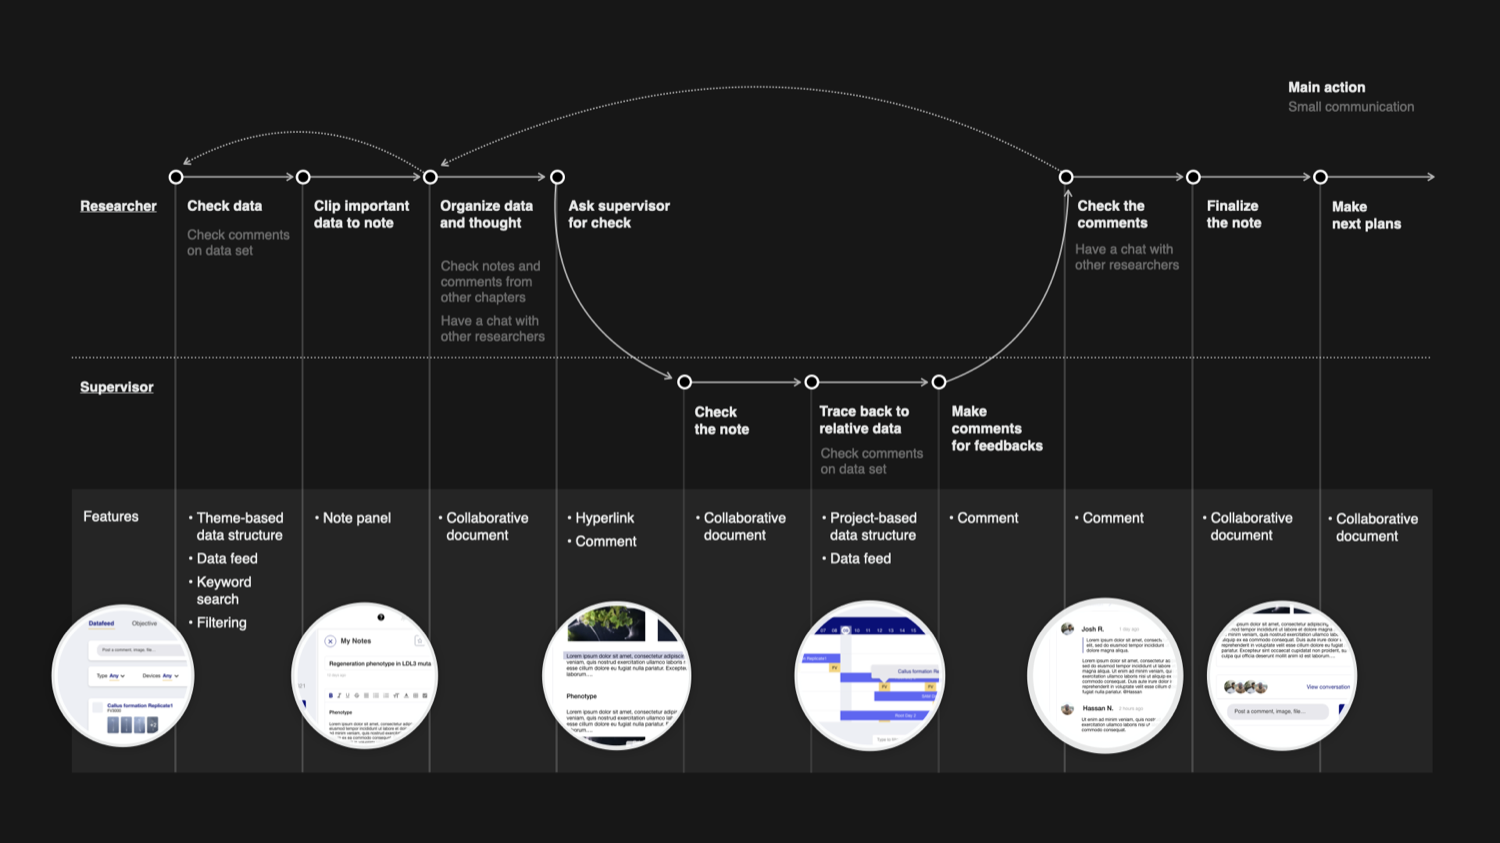
The platform lets users connect the devices to the dashboard, which sends data for researchers to manage. They create a project based on the IA, move images and data to the right stage, favourite and share images, and collect their thoughts in a notes panel. A communication function lets them comment on photos, tag colleagues, and share notes with a supervisor for feedback and validation.
By digitally tracking experiments, comments, discussions and notes, a lab’s knowledge base gains a digital presence – rather than living inside one senior researcher who might be hard to reach.
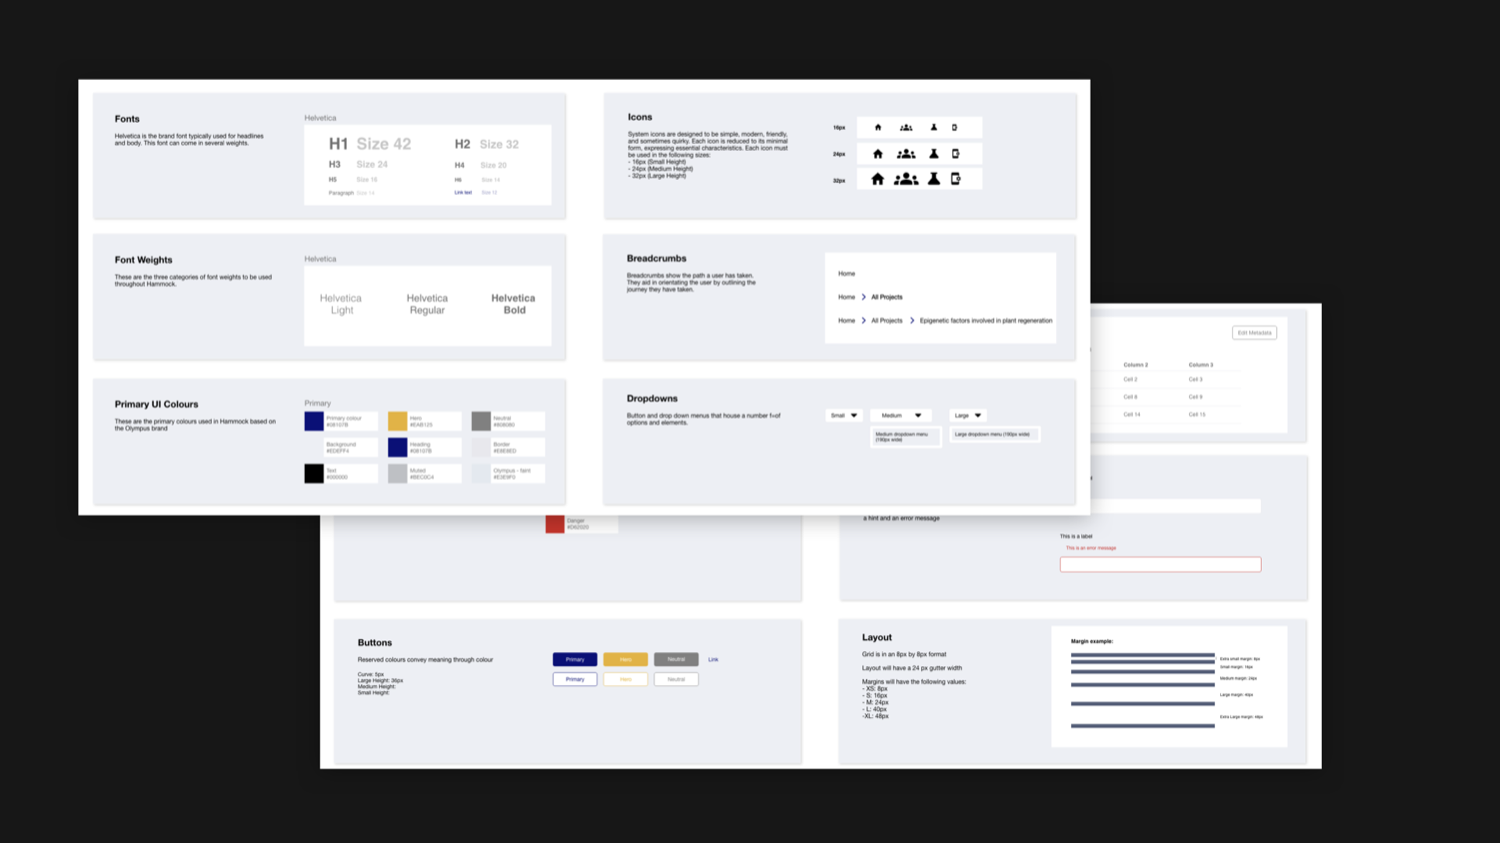
Handover
Along with the solution, the client needed a “rule book” – a graphic of how the solution works across the ecosystem and its users – plus a style guide. I defined the elements of the style guide and we presented them to the client, in a way their design team could pick up easily.